Server Response Time: Common Issues And Fixes
6/1/2026 • 14 min read

Server Response Time: Common Issues And Fixes
When your website takes too long to respond, users leave. Server response time, often measured as Time to First Byte (TTFB), is a critical factor in performance. A good TTFB is under 800 ms, while anything over 1,800 ms is poor. Slow response times hurt user experience, SEO, and conversions. Common causes include slow databases, underpowered servers, or network delays.
Key Fixes:
- Measure TTFB: Use tools like Lighthouse or Chrome DevTools.
- Upgrade Hosting: Switch to VPS or dedicated servers with NVMe SSDs.
- Enable Caching: Use server-level or CDN caching to reduce load.
- Optimize Databases: Add indexes, reduce queries, and use Redis.
- Use a CDN: Cache content closer to users to cut latency.
- Reduce Overhead: Audit plugins, minimize redirects, and streamline code.
Server performance isn't just about speed - it’s about retaining users and improving outcomes. Start by identifying bottlenecks and fixing them layer by layer.
How To Reduce Server Response Time & Improve TTFB
sbb-itb-641714f
Diagnosing Common Server Response Time Issues
TTFB delays often indicate underlying issues that need specific investigation and resolution.
Step-by-Step Diagnosis Workflow
Start by gathering field data instead of relying solely on lab-based tools. Tools like PageSpeed Insights or Search Console can give you the 75th percentile TTFB for mobile and desktop users. This real-world data accounts for factors like redirects and geographic differences that lab tools might overlook.
Once you have your baseline, use Chrome DevTools to dig deeper. Navigate to the Network tab and select Timing. Look at the "Waiting for server response" row - if this dominates your TTFB, the problem is likely server-side. To confirm, add a cache bypass parameter (like ?nocache=1) to your URL and test again. This helps you measure origin server performance without interference from CDN or server-side caching.
For more precise insights, implement the Server-Timing header. This allows you to see detailed timing data (e.g., database query durations) directly in DevTools, helping you pinpoint specific bottlenecks instead of dealing with vague "server issues."
Matching Symptoms to Root Causes
Not all TTFB issues are created equal. The specific pattern of slowness can reveal its root cause:
| Symptom | Likely Root Cause | Diagnostic Method |
|---|---|---|
| High TTFB globally, all users | Slow database queries or inefficient app logic | Use the Server-Timing header or APM tools |
| High TTFB in specific regions | Geographic distance or missing CDN coverage | Multi-region synthetic monitoring |
| TTFB spikes during peak hours | Under-provisioned infrastructure or connection pool exhaustion | Monitor CPU/memory metrics on hosting dashboard |
| High TTFB on first visit only | Slow DNS resolution or missing TLS session resumption | Use WebPageTest or the Navigation Timing API |
| High TTFB for logged-in users | Slow session validation or user-specific database queries | Segment user data with real-user monitoring (RUM) |
Pay special attention to p95 and p99 latencies. While average TTFB may look fine, a significant number of users - often those most likely to leave - might be experiencing severe delays. As the Webalert Team explains:
"TTFB is invisible to most monitoring setups because it sits at the boundary between your network, your CDN, your reverse proxy, and your application."
These insights will help you choose the right tools and methods for further analysis.
Using Tools to Find Problems
A simple command-line check can provide quick insights:
curl -w "TTFB: %{time_starttransfer}s\n" -o /dev/null -s [URL]
Run this command multiple times to assess consistency. If results vary significantly, it could point to issues like connection pool exhaustion or intermittent resource constraints.
For a more comprehensive look at your site's performance, try tools like CLUNKY.ai's dCLUNK™. This free scanning tool identifies performance problems, including high TTFB, and flags unoptimized assets while also offering insights into UX, accessibility, and compliance. It’s a great way to get an initial overview before diving into detailed backend diagnostics.
Infrastructure and Hosting Fixes for Faster Response Times
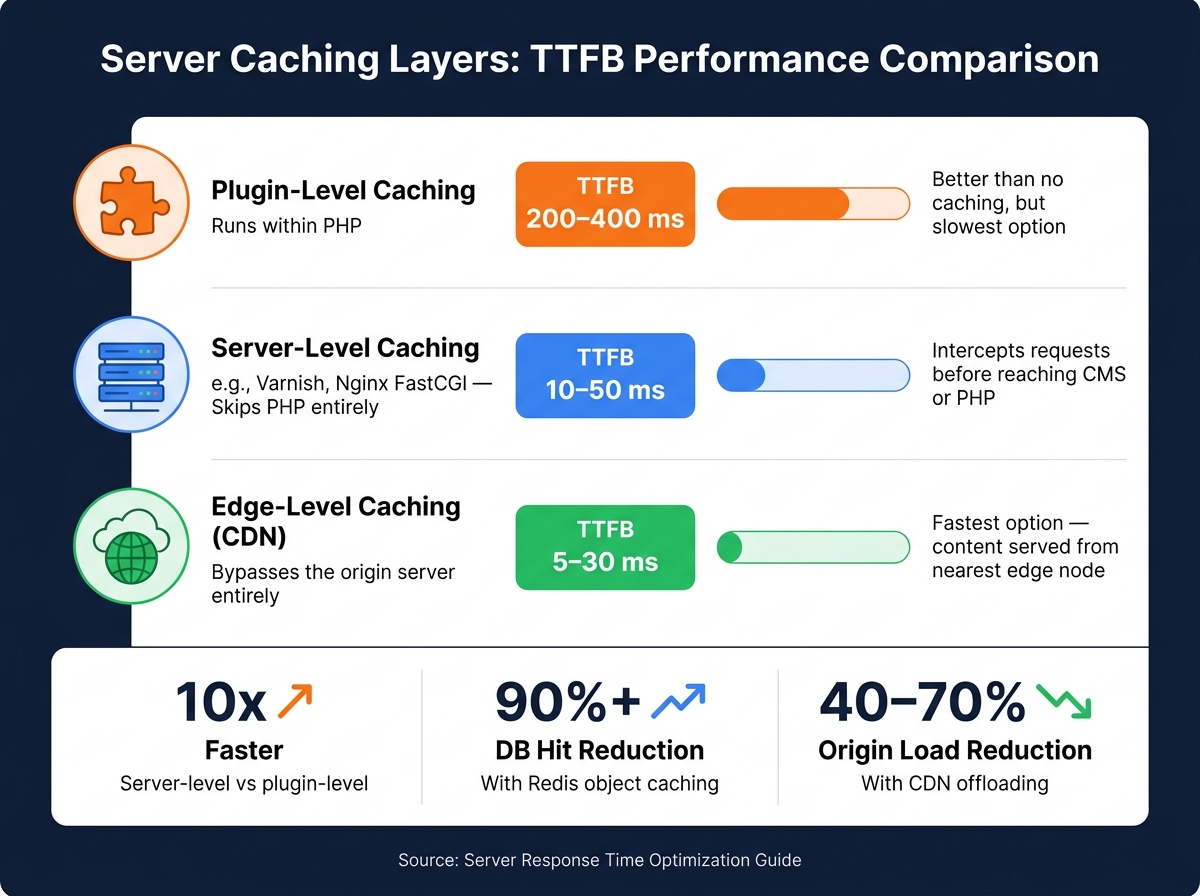
Server Caching Layers: TTFB Performance Comparison
Even the best code optimizations can't overcome the limitations of an underpowered server.
Optimizing Hosting Resources
Shared hosting often slows down your site because multiple websites share the same CPU and memory. If one of these "noisy neighbors" hogs resources, your performance suffers. If your Time to First Byte (TTFB) is consistently over 600 ms, it might be time to upgrade to a VPS or dedicated server. These options provide dedicated CPU and RAM, ensuring better performance.
The type of storage also matters. NVMe SSDs are much faster than SATA SSDs or traditional HDDs, especially when handling frequent database queries.
If you're running WordPress, upgrading from PHP 7.x to PHP 8.x can improve performance by 20–40%. Pair this with PHP OPcache for even better results. Avoid using PHP-FPM’s ondemand mode, as it causes delays by starting new workers for each request. Instead, opt for pm = static or pm = dynamic for smoother performance.
Enabling HTTP/2 or HTTP/3 is another smart move. HTTP/3, built on the QUIC protocol, reduces the number of round trips needed for connections. This is especially helpful for mobile users, where network conditions can vary.
While optimizing server resources is key, reducing network latency is just as critical for improving response times.
Reducing Network Latency
Even with an optimized server, the physical distance between your server and users can add unavoidable delays. A Content Delivery Network (CDN) solves this by caching your content on servers closer to your users. This is especially useful if your origin server is in one region (e.g., the East Coast) but your audience spans the U.S., including the West Coast and Midwest.
CDNs like Cloudflare offer tools like Cloudflare APO (Automatic Platform Optimization), which caches full HTML pages at the edge. This can reduce TTFB for cached requests to just 5–30 ms.
Other ways to cut latency include minimizing redirects and optimizing DNS settings. Each redirect adds a round-trip delay, and slow DNS lookups (over 100 ms) can further drag down performance. Using a fast DNS provider and adding HTTPS DNS records (RFC 9460) allows browsers to negotiate HTTP/3 during the initial lookup, saving an extra round trip for first-time visitors.
"LCP cannot be faster than TTFB. The browser cannot begin downloading any resource - images, CSS, fonts - until it has parsed the HTML." - Digital Codex
Setting Up Server Caching
Once hosting and network optimizations are in place, caching provides one of the most effective ways to reduce TTFB. However, not all caching methods are created equal.
| Caching Layer | How It Works | Typical TTFB |
|---|---|---|
| Plugin-level | Runs within PHP | ~200–400 ms |
| Server-level (e.g., Varnish, FastCGI) | Skips PHP entirely | ~10–50 ms |
| Edge-level (CDN) | Bypasses the origin server | ~5–30 ms |
While plugin-based caching is better than no caching, server-level caching (like Nginx FastCGI cache or Varnish) intercepts requests before they even reach your CMS or PHP engine. This can cut response times dramatically - an uncached WordPress request might take 500–2,000 ms, while a Varnish-cached response can drop to just 10–50 ms.
For dynamic sites like WooCommerce or membership portals, where full-page caching isn’t always possible, Redis object caching can store results of complex database queries in RAM. This allows the server to fetch results instantly rather than running the same SQL queries repeatedly. If your site experiences sudden traffic spikes, microcaching with short lifetimes (1–5 seconds) can keep content up-to-date while preventing server overload.
Another useful tactic is configuring the stale-while-revalidate directive in your Cache-Control headers. This lets the server serve a cached version immediately while refreshing the cache in the background, ensuring users don’t face delays during cache misses.
For ongoing performance monitoring, tools like CLUNKY.ai's dCLUNK™ website scanner can identify bottlenecks and provide actionable recommendations to keep response times low.
Application and Database Optimizations
Once you've tackled hosting and network inefficiencies, the next step to reducing TTFB (Time to First Byte) is improving your application logic and database performance. Even with fast hosting and a CDN, poorly optimized code and database queries can still drag down response times. These issues are rooted in your application's code and data layers, requiring precise adjustments to address.
Improving Database Query Performance
After fine-tuning your infrastructure, turn your attention to the application and database layers. Two common issues that slow database performance are missing indexes and N+1 query patterns. Missing indexes force the database to scan every row in a table to find results. For high-traffic tables like WooCommerce product metadata, this can add 300–500 ms to every request. Adding composite indexes, such as on the meta_key and post_id columns in the wp_postmeta table, can reduce query times to under 100 ms. To avoid N+1 queries, consolidate item details into a single JOIN or batch query.
For example, in April 2026, WordPress performance consultant James Keller documented a dramatic improvement in TTFB - from 1.8 seconds to 0.6 seconds - by restructuring indexes, cleaning up orphaned metadata, and adding Redis object caching. These changes reduced queries per page by 66% and improved backend response times by 73%. Redis caching alone can cut database hits by over 90%.
Other key improvements include connection pooling and slow query logging. Opening a new database connection for each request introduces 5–30 ms of overhead due to the TCP handshake. Connection pooling eliminates this delay by reusing existing connections. Meanwhile, slow query logging (with a threshold of 0.1 seconds) helps identify and prioritize the slowest queries for optimization.
"The fastest response is one your application never has to generate." - Arjen Karel, Core Web Vitals Expert
Streamlining Application Logic
Beyond database optimization, you should also refine your application's code. Synchronous external API calls are a major contributor to longer response times. For instance, if your application makes inline calls to a payment gateway, CRM, or license verification service, it must wait for the external service to respond. This can significantly increase TTFB, especially if the third-party service is slow or unresponsive.
To address this, move non-critical tasks off the critical path. Actions like sending confirmation emails, processing images, or logging analytics data don't need to delay page load times. For WordPress sites, replacing wp-cron with a Linux crontab can prevent random TTFB spikes caused by background tasks. For API calls that must remain synchronous, use circuit breakers to fail quickly if the external service is unresponsive. Pair this with application-level caching, such as Redis or memoization, to avoid repeating expensive computations or API requests unnecessarily.
Enabling PHP OPcache and properly configuring its size can reduce PHP execution time by up to 70%, which translates to a 30–50% decrease in overall request duration.
Reducing CMS and Middleware Overhead
In CMS platforms like WordPress, every active plugin contributes to PHP execution time, even if the plugin's features aren't needed on every page. Start by auditing plugin performance. A binary search method - disabling half the plugins, measuring TTFB, and narrowing down the culprit - can help identify problematic plugins. For instance, a single plugin making a wp_remote_get() call on the init hook could add a fixed 800 ms delay to every uncached request.
Another common issue is excess autoloaded data in the wp_options table. Ideally, autoloaded data should stay under 500 KB, with anything over 1 MB causing noticeable TTFB slowdowns. Deactivated plugins often leave behind autoloaded entries, which can accumulate over time and bloat the database.
| Autoload Size | Performance Status |
|---|---|
| Under 500 KB | Lean database - excellent |
| 500 KB–1 MB | Healthy range |
| 1 MB–2 MB | Noticeable TTFB impact |
| Above 2 MB | Critical - major performance bottleneck |
For WooCommerce stores, migrating to High-Performance Order Storage (HPOS) can significantly reduce database read/write operations - by over 70% - by moving orders from the legacy post-based structure to dedicated database tables.
"Caching doesn't optimize performance - it removes the need for processing entirely." - UXNitro
Finally, tools like CLUNKY.ai's dCLUNK™ can offer actionable insights to maintain fast server response times and improve the overall user experience.
Scaling and Operational Best Practices
Handling Peak Traffic
Even well-optimized applications can falter during sudden traffic spikes if scaling isn’t handled effectively. A common pitfall is relying solely on CPU-based auto-scaling. By the time CPU thresholds trigger new instances, users may already face slowdowns. Instead, use leading indicators like request queue depth or requests per second (RPS) to initiate scaling sooner.
For planned events, such as product launches or flash sales, pre-warm your infrastructure 30–60 minutes ahead of time to avoid delays caused by cold starts. Multi-layer caching, including CDNs, application-level caching, and database caching, can also help absorb surges. Offloading traffic to a CDN alone can reduce the load on origin servers by 40–70%. If demand still exceeds capacity, consider graceful degradation - temporarily disabling non-essential features like wishlists or product reviews to ensure critical functions, like checkout, remain smooth.
"The best time to prepare for a traffic spike is before it happens. The second best time is right now." - Nawaz Dhandala, Author
Here’s a quick guide to matching your architecture with traffic levels:
| Traffic Tier | RPS Range | Recommended Architecture |
|---|---|---|
| Tier 1 | <100 RPS | Single server + DB; add Redis if the database bottlenecks |
| Tier 2 | 100–1,000 RPS | Load balancer + 2–3 app instances + Redis cache |
| Tier 3 | 1,000–10,000 RPS | CDN + auto-scaling + read replicas + Redis cluster |
| Tier 4 | 10,000+ RPS | Multi-region deployment + DB sharding + event-driven architecture |
However, scaling application servers without accounting for database connections can create bottlenecks. The Binadit Tech Team encountered this issue when auto-scaling overwhelmed their database. Tools like PgBouncer can help by managing reusable connections, as establishing new database connections can add 20–80 ms of latency per request.
Once peak traffic is under control, the next challenge is managing bot traffic effectively.
Managing Bot Traffic
Automated traffic makes up 30–50% of all web traffic, and its impact on server performance can be massive. For instance, in 2025, the Wikimedia Foundation reported that AI crawlers caused a 50% surge in bandwidth usage. While these bots accounted for 35% of pageviews, they were responsible for 65% of resource-heavy server requests. Ignoring bot traffic can leave real users dealing with slower response times.
A layered approach works best for managing bots. Combine edge-level defenses, like WAF/CDN rate limiting, with application-level behavioral analysis and business-layer anomaly detection. For rate limiting, avoid simple per-IP rules. Instead, apply sliding-window algorithms and set thresholds based on traffic type. For example:
- 30 requests per minute for verified crawlers
- 2 requests per minute for suspected bots
- No limit for confirmed human visitors
Always verify search engine bots like Googlebot against their official IP ranges, as relying solely on User-Agent strings can be unreliable.
For undeclared AI agents or malicious crawlers, honeypots and tarpits are effective. Honeypots, such as hidden paths like /.env, can immediately identify bad actors, while tarpits slow down their responses without alerting them to detection. Another strategy is serving bots pre-rendered, cached pages to prevent them from triggering costly application-layer processes and competing for bandwidth with legitimate users.
With bots managed, the focus shifts to continuous performance monitoring.
Monitoring and Testing Performance Continuously
Waiting to address performance issues after they occur can be expensive. For example, a 30-second slowdown during peak traffic can cost e-commerce sites thousands in lost sales. That’s why continuous monitoring is critical. Focus on the four Golden Signals: Latency, Traffic, Errors, and Saturation. Additionally, monitor the 95th and 99th percentile response times, as averages can mask serious delays for a portion of users.
To achieve full visibility, use an observability stack like:
- Prometheus for metrics
- Grafana for visualization
- Jaeger or OpenTelemetry for distributed tracing
Set alerts based on Service Level Objectives (SLOs) rather than arbitrary thresholds. This ensures your team is notified only when user experience is genuinely impacted, such as when Time to First Byte (TTFB) degrades. Before deploying changes, validate them in a staging environment. Tools like perf-sentinel can analyze traces during CI/CD pipelines and flag issues like N+1 queries before they affect live traffic.
Conclusion: Key Takeaways for Improving Server Response Time
Reducing server response time involves tackling issues across multiple layers: infrastructure, application code, and database performance. Some of the most impactful changes include deploying a Content Delivery Network (CDN), implementing full-page caching, and adding missing database indexes. Together, these steps can cut median request durations by up to 10x.
"Since TTFB underpins overall page performance, address it before optimizing front-end assets." - Digital Codex
At the network level, enabling HTTP/3 and TLS 1.3 can significantly reduce connection overhead. Additionally, removing redirect chains eliminates unnecessary round trips. Aim for a Time to First Byte (TTFB) of 800ms or less - anything over 1.8 seconds demands immediate action, as TTFB directly impacts metrics like Largest Contentful Paint (LCP).
Continuous monitoring is essential to sustain these improvements. Use tools like Server-Timing headers to identify backend bottlenecks in browser developer tools. Instead of relying on averages, focus on p95 and p99 percentiles, which highlight worst-case scenarios that can quietly drive users away. Platforms like CLUNKY.ai's dCLUNK™ can help pinpoint issues, including TTFB, while also evaluating UX, accessibility, and compliance metrics. This gives you a clear roadmap for prioritizing fixes.
"A slow first response increases bounce risk, lowers form completion, and makes every paid click cost more." - 5n2 Digital
Server performance improvements should be approached as an interconnected process. Infrastructure upgrades, caching strategies, query optimizations, and ongoing monitoring work best when combined. Address these areas in order of their impact, validate changes in a staging environment, and monitor production performance to ensure results hold up under real-world conditions. Always optimize server-side performance before shifting focus to frontend assets.
FAQs
What’s the fastest way to tell if my high TTFB is server-side or network-related?
When testing TTFB (Time to First Byte), check it from multiple locations. If the TTFB is consistently high regardless of the region, the issue is likely server-related. However, if the TTFB varies by location, the problem might be tied to network conditions.
To dive deeper, use the Network tab in Chrome DevTools. Look at the Server Timing section (or implement Server-Timing headers) to pinpoint the cause. This can help you determine if backend processes, such as database queries or cache misses, are causing delays. Alternatively, the issue might stem from connection problems or redirects.
Which caching layer should I implement first to lower TTFB the most?
To bring down Time to First Byte (TTFB) drastically, start by implementing full-page caching. This method stores pre-rendered HTML in memory using tools like Redis, Memcached, or NGINX fastcgi_cache, allowing you to cut TTFB to under 50 milliseconds.
Once that's in place, you can push performance even further. Add application-level object caching to handle database query results efficiently. Finally, use CDN edge caching to serve content from servers closer to your users, reducing latency and speeding up delivery.
How do I find the specific database queries or plugins causing slow TTFB?
To figure out which database queries or plugins might be slowing down the Time to First Byte (TTFB), you can use the Server-Timing response header. This header sends timing metrics directly to the browser, which you can then review in Chrome DevTools under the Timing tab to pinpoint bottlenecks.
For database-related issues, start by checking slow query logs or running the EXPLAIN command to analyze query performance. Be on the lookout for N+1 query patterns, which can significantly degrade performance.
If you're working with WordPress, take a closer look at the quality of your plugins. Some plugins may introduce inefficiencies, so auditing them is key. Additionally, implementing object caching can help reduce database load and improve performance.
For a more advanced solution, tools like dCLUNK™ by CLUNKY.ai can assist in identifying and addressing performance problems effectively.
Explore the six basics
Every Clunky AI article maps back to one or more of the questions a business site has to answer.
Related Posts
Tags PerformanceResponsive DesignUser Experience
Category Website Optimization