Latency and Its Effect on Conversions
6/8/2026 • 11 min read

Latency and Its Effect on Conversions
Latency directly impacts your website's ability to convert visitors into customers. Here's what you need to know:
- Every second counts: A 1-second delay can reduce conversions by 7% and increase bounce rates by 32%.
- Revenue losses: For a business generating $100,000 monthly, just 1 extra second of load time could cost $7,000 per month.
- Mobile users suffer more: Over 53% of mobile users abandon sites that take longer than 3 seconds to load.
- Key metrics to watch: Focus on improving Time to First Byte (TTFB), Largest Contentful Paint (LCP), and Interaction to Next Paint (INP) to reduce delays.
Even small speed improvements, like cutting load time by 0.1 seconds, can boost conversion rates by 8.4% or more. If your site is slow, you're leaving revenue on the table. Fixing latency issues isn't just about speed - it's about saving money and improving user trust.
The Silent Bleed - How Site Speed Taxes Every Click, Cart, and Conversion
sbb-itb-641714f
How Latency Shapes User Behavior
Latency doesn’t just slow down page load times - it changes how users interact with your site. When visitors encounter delays, their browsing and engagement patterns shift, often leading to frustration and abandonment. Below, we’ll break down how these delays influence user behavior.
Bounce Rates and Session Drop-Offs
The first few seconds after a page loads are crucial. Research shows that bounce rates are around 9% for pages that load in under a second. But when load times stretch to 1–2 seconds, bounce rates jump to about 38%. If delays exceed 3 seconds, they can skyrocket to an alarming 95%. These numbers highlight how slow load times can drive visitors away and waste your ad spend.
Fewer Micro-Conversions
Latency doesn’t just determine whether users stay - it also affects the smaller actions that lead to a purchase. Actions like clicking on a product, applying filters, or adding items to a cart (known as micro-conversions) rely heavily on quick site responsiveness.
The Interaction to Next Paint (INP) metric measures how fast a site responds to user input. Studies reveal that every 32ms of delay translates to a 1.5% drop in conversions. As Eknix points out:
"Waiting feels like a reliability problem. If a site cannot load its own product page, why would a shopper trust it with their card details?"
This issue becomes even more pronounced on mobile devices.
Mobile Users and Slow Networks
Mobile users feel the impact of latency even more. On average, the Largest Contentful Paint (LCP) for mobile is 4.1 seconds, compared to 2.3 seconds on desktop. The slower performance on mobile is due to both device limitations and network speeds.
For example, third-party scripts that add 1.4 seconds of blocking time on desktop can cause delays of 4.6 to 14 seconds on a mid-range Android device. Even small improvements can make a big difference here - a 0.1-second reduction in mobile load time has been shown to increase retail conversion rates by 8.4% and boost average order values by 9.2%.
As Mateusz Krzeszowiak from Shopify explains, "Every fraction of a second your store takes to load shapes your customer's experience - and your bottom line."
What the Research Says: Latency and Conversion Rates
Research consistently shows that slow load times can hurt your revenue. Across industries, studies have quantified just how much those milliseconds can cost.
Amazon's 100 ms Rule
Back in 2006, Amazon conducted A/B tests by delaying page responses in 100-millisecond intervals. The results? Each 100 ms delay led to a 1% drop in sales. Fast forward to Shopify's 2026 analysis, which found that a 100 ms delay in Largest Contentful Paint (LCP) caused a 3.5% drop in conversions. These numbers clearly reflect the user drop-offs caused by even minor delays.
"The relationship between milliseconds and money is well-documented enough at this point that treating performance as a secondary concern is, plainly, a commercial mistake."
Google's Search Latency Experiment
In June 2009, Google ran an experiment by adding delays of 100–400 milliseconds to search results over six weeks. They found that a 400 ms delay reduced searches per user by 0.76%, while a half-second delay caused a staggering 20% drop in query traffic. Even more concerning, users didn’t immediately return to their normal behavior once the delays were removed - searches remained 0.21% lower for the next five weeks. As Brutlag noted:
"Even if the page returns to the faster state, users who saw the longer delay take time to return to their previous usage level."
This highlights how latency impacts not only immediate activity but also long-term user engagement.
The Milliseconds Make Millions Report
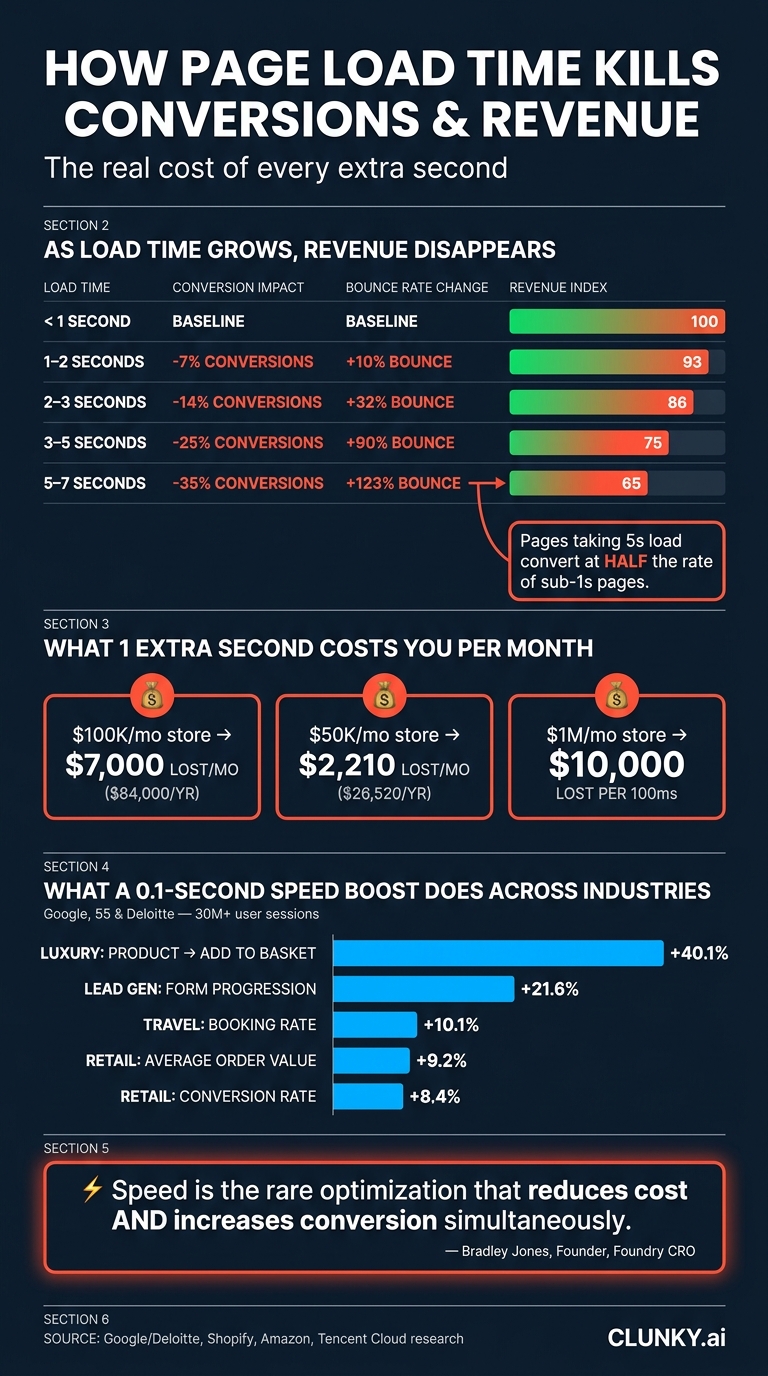
A 2019 study by Google, 55, and Deloitte analyzed over 30 million user sessions across 37 brand websites. By isolating speed as the only variable, they uncovered how a mere 0.1-second improvement could make a big difference:
| Industry | Metric | Impact of 0.1s Improvement |
|---|---|---|
| Retail | Conversion rate | +8.4% |
| Retail | Average order value | +9.2% |
| Travel | Booking rate | +10.1% |
| Luxury | Product detail → Add to Basket | +40.1% |
| Lead Gen | Progression to form submission | +21.6% |
"The results show that even a 0.1 second improvement in load times can improve progression rates across the full purchase funnel."
These findings underline how small performance improvements can lead to noticeable business growth. Even shaving off fractions of a second can translate into higher conversions, larger orders, and better engagement across industries.
The Financial Cost of Latency for Small Businesses
How Page Load Time Kills Conversions & Revenue
Latency isn't just a technical hiccup - it’s a direct hit to your revenue, and for small businesses in the U.S., that loss adds up fast. Delays in page load times act like a silent tax, chipping away at your earnings every single day.
Revenue Lost Per Second of Delay
Let’s break it down: if your store generates $100,000 a month, adding just one extra second to your page load time could cost you about $7,000 per month - or a staggering $84,000 a year. For a smaller business pulling in $50,000 monthly, that same one-second delay translates to $2,210 in lost sales each month, which adds up to $26,520 annually.
Industry experts back this up:
"Every 100ms costs you real money. For a $1M/month business, 100ms latency = $10K/month lost revenue." - Tencent Cloud
On the flip side, the rewards of speeding up your site are just as striking. Take the example of an e-commerce store in 2026: by cutting its load time from 3.8 seconds to 0.9 seconds, the store saw its conversion rate jump from 1.8% to 2.7%. That’s a 50% increase, leading to an additional $250,000 in monthly revenue - without spending more on ads or driving extra traffic.
How Conversion Rates Fall as Load Times Grow
The longer your page takes to load, the more your conversion rates plummet. The numbers after the 3-second mark are especially brutal:
| Load Time | Conversion Impact | Bounce Rate Change | Revenue Index (vs. <1s) |
|---|---|---|---|
| < 1s | Baseline | Baseline | 100 |
| 1–2s | -7% | +10% | 93 |
| 2–3s | -14% | +32% | 86 |
| 3–5s | -25% | +90% | 75 |
| 5–7s | -35% | +123% | 65 |
Pages that take 5 seconds to load convert at about half the rate of those that load in under a second. And here’s the kicker: eCommerce sites currently have the worst Core Web Vitals pass rate across industries - just 37% - with a median Largest Contentful Paint of 4.8 seconds. This means most online stores are already in the danger zone.
User Groups Most Affected by Latency
Latency doesn’t hit all users equally. Mobile users bear the brunt of it. With over 60% of web traffic coming from mobile devices, it’s alarming that 53% of mobile users abandon sites that take longer than 3 seconds to load. Mobile conversion rates are already 50–60% lower than desktop, but improving speed can narrow that gap by up to 30%.
Another group to watch? Paid traffic visitors. If you’re running Google Ads, a slow landing page doesn’t just hurt conversions - it also hikes up your Cost Per Click (CPC). Google penalizes slow pages with lower Quality Scores, meaning you’ll pay more for traffic that’s less likely to convert. In contrast, an "above average" landing page experience can lower your CPCs by 36%.
"Speed is the rare optimization that reduces cost and increases conversion simultaneously." - Bradley Jones, Founder, Foundry CRO
In short, improving your load time isn’t just a technical tweak - it’s a revenue-saving strategy that pays off on multiple fronts.
How to Measure and Fix Latency Issues
Identifying that latency is affecting your conversions is just the first step. The real challenge lies in figuring out where the problem is and how to address it. The good news? A few key metrics can reveal almost everything you need to know.
Key Metrics to Track
When diagnosing latency issues, focus on these four metrics:
| Metric | What It Measures | "Good" Threshold |
|---|---|---|
| TTFB (Time to First Byte) | How fast your server responds | ≤ 800ms |
| LCP (Largest Contentful Paint) | How quickly the main content appears | ≤ 2.5s |
| INP (Interaction to Next Paint) | How fast the page responds to user interactions | ≤ 200ms |
| CLS (Cumulative Layout Shift) | Visual stability during loading | ≤ 0.1 |
TTFB is where it all begins. On slower pages, TTFB alone can account for 40–60% of total LCP time, which means server response speed directly affects every other loading metric, including LCP, FCP, and Speed Index.
LCP, on the other hand, measures how quickly the main content loads and strongly correlates with conversion rates. For instance, in 2026, fashion e-commerce brand Farfetch reported a 1.3% drop in conversions for every 100 milliseconds of additional LCP. Meanwhile, INP continues to be the most commonly failed metric, with 43% of all sites missing the 200ms threshold in 2026.
By tracking these metrics, you can pinpoint the exact areas where your site is underperforming.
Scanning for Latency Issues with dCLUNK™
Once you’ve identified which metrics to measure, the next step is locating the specific delays. Manually tracking performance across your entire site can be overwhelming. That’s where CLUNKY.ai’s dCLUNK™ becomes invaluable. This tool scans your website to uncover performance bottlenecks, covering TTFB, LCP, TBT/INP, and CLS, alongside UX, accessibility, and compliance issues. It also provides actionable, prioritized recommendations, so you know exactly what to fix and in what order. Plus, with free scans, it’s accessible even for small businesses without a dedicated development team.
Where to Focus First for the Biggest Gains
Not every page on your site requires equal attention. Start with your "money pages" - checkout flows, pricing pages, lead capture forms, and high-performing landing pages. These are the pages where latency has the most direct impact on revenue. Fixing these first not only improves speed but also boosts conversions.
Next, tackle high-traffic templates. For example, if your product page template is slow, optimizing it once can improve performance for all product pages at once. Since Google prioritizes mobile performance for rankings, always review your mobile scores first - mobile users tend to generate the most traffic and are highly sensitive to delays.
"At $30K+ in monthly ad spend, a 1-second LCP improvement returns more recoverable revenue than 6 weeks of creative testing." - Aditya Chaturvedi, Founder, BTB Audits
The quickest wins often come from removing unnecessary elements rather than adding new optimizations. Oversized images, unused third-party scripts, and render-blocking JavaScript are frequent culprits. As one SEO expert noted:
"The fix that delivers ROI is rarely the fix that's easiest to talk about. Most page-speed wins come from removing things - third-party scripts, oversized images, blocking JavaScript - not from adding clever optimisation tricks." - SEOTopSecret
Conclusion: What Latency Costs You and How to Fix It
Latency doesn't just slow down your website - it directly impacts your bottom line. For every 100ms of delay, sales can drop by about 1%, and a single second of lag might slash conversions by as much as 7%. But the damage doesn’t stop there. Latency hurts your search rankings, discourages repeat visits, and chips away at customer trust. With Google tightening its "Good" LCP threshold from 2.5 seconds to 2.0 seconds in March 2026, the pressure to optimize website performance is only increasing.
The good news? Fixes can deliver fast results. Take this example: in early 2026, a mid-size European e-commerce site selling industrial equipment cut its mobile LCP from 4.2 seconds to 1.8 seconds in just six weeks. How? By switching to AVIF images and inlining critical CSS. The payoff? A 23% boost in mobile conversions, adding an extra ~$15,600 in monthly revenue. The investment paid for itself in just 17 days.
"Performance is never 'finished,' it's an ongoing commitment." - Shopify
Treat performance as a continuous priority. New scripts, updates, and content changes can gradually slow your site. That’s why regular monitoring - not just occasional audits - is key to maintaining speed. Tools like CLUNKY.ai's dCLUNK™ provide real-time insights into metrics like LCP, INP, CLS, and TTFB, along with actionable tips to keep your site running smoothly.
Improving speed isn’t a one-and-done project - it’s an ongoing effort. Keep it at the forefront.
FAQs
Which pages should I speed up first to get the biggest conversion lift?
To make the biggest impact, concentrate on the pages that are crucial to your funnel and show signs of underperformance. Start with landing pages, aiming for a P95 load time of 2.0 seconds. Next, address product pages (2.5 seconds) and then checkout pages (3.0 seconds). These high-traffic pages are where speed improvements can lead to noticeable conversion boosts.
For identifying issues related to performance, user experience, and accessibility, tools like CLUNKY.ai’s dCLUNK™ can be a helpful resource. They can pinpoint the exact areas needing attention and guide your optimization strategy effectively.
How can I tell if the slowdown is my server, images, or third-party scripts?
If your website is running slow, Chrome DevTools can help you identify the problem areas. Start by examining Time to First Byte (TTFB) to assess server latency. Then, check how long resources like images take to load. Use the Coverage and Performance tabs to analyze third-party scripts. Pay attention to high TTFB, slow image load times, or long tasks marked in red. Tools such as CLUNKY.ai's dCLUNK™ can provide detailed analysis and practical suggestions to improve your site's speed.
What’s the fastest way to monitor TTFB, LCP, and INP on my site over time?
To monitor TTFB, LCP, and INP effectively over time, it's best to combine real-user monitoring with synthetic testing. The web-vitals JavaScript library is a great option for collecting precise data directly from your site visitors. For tracking historical trends, tools like the Chrome User Experience Report (CrUX) or scheduled monitoring services can provide valuable insights.
If you encounter technical hurdles, CLUNKY.ai’s dCLUNK™ tool can be a game-changer. It helps identify and analyze performance, user experience, and accessibility issues, while also offering actionable steps to improve your site's overall performance.
Explore the six basics
Every Clunky AI article maps back to one or more of the questions a business site has to answer.
Related Posts
Tags PerformanceResponsive DesignUser Experience
Category Website Optimization